

Review:
The gold opened at 636.6, day high at 665.6 day low 661.3 and closed 636.6 which same as opened. However the crude oil price rise 2.6% due to the tension on Iran. Oil had rised up to 68.09 when rumors U.S force attack Iran.
Technical:
Weekly Chart
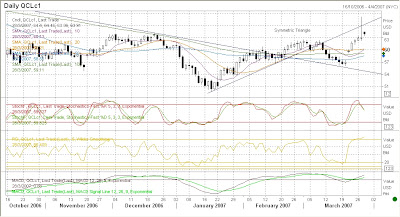
On the weekly chart, we can see it very clearly that the top was made on May last year at near 730, and the next top was made at the end of Feb. It was techincally fall in a ascending triangle. In general, the gold would have a big jump when ascending triangle appears. SMA 10 is now 657.25 where SMA 20 is 642.15. These would be a great support for gold at the moment. Where RSI, Stochastic and MACD matched with upward trend gives strong confidence the gold is moving upward.
Daily Chart
Resistance and supporting line is stated on the chart. The supporting trend line for the current period is 660. If price fall below the support trend line would indicate the up trend broken. SMA 10 is above SMA 20 and SMA 50 with other indicators such as RSI and stochastic, MACD tend to upward and would believe the up trend would still persist. Notice that the RSI is near 60 would means this is not the best time to buy gold unless already have profit on hand. Major Resistance would be on 676.
Market Data and News:
The tension in Iran would gives great support on oil and gold. Crude oil rose for a seveneth day in New York on conern a dispute on Iran's detention of British force could escalate, disrupting supplies from the Middle East. Investors concern on military conflict in the Middle East. Iranian foreces seized 15 British forces on 23rd of March and by history U.K has been pretty tough in dealing with these situation. Oil prices have gained 10% in the past 2 weeks as United Nations agreed new sanctions to stop Iran's nuclear research and gasoline break-downs sapped stockpiles.
Euro and others currencies are now moving up caused by the inflation from high oil price and strong economy growth and the contrast from U.S running in recession. Weaken USD would give support for gold. In general, gold runs in opposite direction with USD.
Durable goods order (Feb) would be released on 20:30 HK time. The market would probably have no effect with this result on gold market. Investors now attention on oil price and tension on Iran.
Strategy:
Long Position: 663, 665
Stop Loss: 658, 661
Short Position: 668, 676
Stopt Loss: 673, 679

0 則留言:
發佈留言
訂閱 發佈留言 [Atom]
<< 首頁