星期二, 4月 24, 2007


Review:

昨日現貨金價盤中高開693、高位693.6、低位686.6收市報688.8。全日預昨天的所料在高為震盪、試穿685的位置、不果。及後現貨金回升至691.5收市低於前日收市。出現高開低收的局面。昨日亦沒有重大數據出爐、略見美元會升、美元從連續9日的跌勢下輕微反彈、但弱勢未改。相信是預先對今日美國數據的反應。各貨幣對美元走弱亦是金市出現沽壓的主因。

Technical:

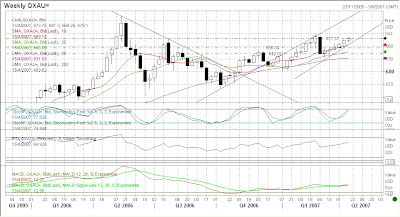
Weekly Chart

在星期圖裡面目前一反過往7星期的狀況、見到有黑色的candle、目前相未跌穿上週的低位678。整體金價仍然偏好。安全一點可以在679左右買入、跌穿676止蝕。 技術指標亦出現了開始轉勢的兆頭、投資者可以693.8位頂位作出沽貨的動作。

Daily Chart

日線圖方面、價位仍然在上升通道的上方、靠在10天平均線有支持685.62美元。圖中可見綠色線為上升稽型圖、昨天和前天都曾經出現突破。惟現在在上線的下方、進取的投資者可選擇再688買入、跌穿685止蝕。

Market News and Data:

今晚出的美國數據
4月消費者信心指數: 預測105.0 上次數字 107.2
3月二手樓銷售: 預測645萬 上次數字 669萬

Strategy:

買入: 686、678
止蝕: 683、675

沽出: 692、695
止蝕: 695、697


Review:

現貨金上個交易日開於686美元、最高見693.6、低位在678.7、收市在691.25。整個星期都係屬於升勢。星期五曾下試678的重要支持位、不果。及後更升穿近11個月高位至693.6。市況係先跌後升。

Technical:


Weekly Chart

上升通道未變、需然連升8個星期、惟基本因素及技術面良好、大市偏向測試700美元心理關口。支持位在688美元、重要支持在678美元。

Daily Chart

在日線圖可以清楚見到現貨金在上升軌道的上方。助力位在695美元、如上穿上升軌道的話可破700美元關口。今日相信會在高位震盪。

Market Data and News:

新的珀金EFT基金將會面世、需求量會增加、亦會引致黃金價值上升。
市場focus中國加息、過往在大假期前做宏觀調控、投資者需要留意各樣投資。
銅價睇實際需求、印尼銅鐵制造廠停止罷工、需要觀望銅價的就勢、可能會對黃金有些微影響。
另一方面日圓亦要小心其走勢。長假前交易員可能先行平倉買回日圓引發各類型投資產品下跌。

Strategy:

買入: 688、680
止蝕: 684、676

沽出: 693、698
止蝕: 696、701

星期三, 4月 18, 2007


Review:

昨日現貨金開市在690美元、全日在高位窄幅震盪、昨日波幅最高在690.8美元、最低在685.8美元、收市報687.6美元。全日整體錄得輕微跌幅0.35%。美國CPI與市場預期一樣2.8%對比上月的2.4%為高。扣除食品及能源為2.5%比起市場預(2.6%)及上次(2.7%)輕微下跌。Indutrial Production 和 Capacity Utilization 分別為-0.2%及81.4亦比上次做差。市場預期減息的機會增加、從而將金價推向全日高位690.8美元。及後因為高位有擭利了結令金價回吐漲幅。

Technical:

Weekly Chart

現貨金連續上升7個星期。現在仍然在上升通道、未有signal會向下、所以仍然維持看好。

Daily Chart

在日線圖中可見金價仍然在上升軌道中、未有出現單日轉向或十字星的訊號、所以策略仍然維持逢低買入。目前指標再高位修復、修復後有很大的機會再次向上。短期阻力線在691、支持在683.5

Market News and data:

今日有EIA crude oil數據在10:30香港時間出

Strategy:

買入: 685, 683.7
止蝕: 681

沽出: 690.5
止蝕: 694

星期一, 4月 16, 2007


Review:

現貨金上星期以上升為終結、最高見685.8美元、收市報685.1美元、上升$11.35美元或1.68%。金價從632美元起步已連續上升6個星期、以上個星期五收市的價格計算已有
53.1美元的漲幅。主要受惠於美元下跌、油價上升的因素影響。上星期G7會中默許美元及日圓貶值亦令到現貨金即時上升了7美元至全星期最高位。投資者須留意本周的
美國數據及日圓的走勢、因日本將會有兩個星期的長假期、專業投資者可能會先行平倉引發起小型日圓利差交易坼倉活動。

Technical:

Weekly Chart

在圖表中可見、金價對上一次升浪在602美元起步、一直升到689美元始回落、達87美元漲幅。按同樣的比例計算金價在今次的升浪應由632美元升至719美元。考慮到717美元有阻力、所以參考價值甚高。距離現價有32美元水位。 從技術指標來看、現價還沒有到頂位、尚有上升空間、建議逢低吸納。

Daily Chart

現階段明顯在上升軌道中、短期支持位在684.2及677.57較大的支持位在668.78及663.36。上升阻力在689、717、730。

Market News and Data:

上周美元兌主要貨幣進一步下跌,而今早美元兌主要貨幣更跌穿近期的低位,歐元兌美元曾高見1.3576,英鎊兌美元曾見1.9890,而美元兌日圓曾見119.66。上周美元下跌一方面是由於美國公佈的經濟數據仍然顯示美國經濟增長處於放緩,通脹壓力輕微降低,而另一方面市場預期上周G7會議不會對日圓匯率發表嚴厲聲明對日圓構成壓力,因此支持主要貨幣兌日圓進一步上升,由於歐洲貨幣及商品貨幣兌日圓的升幅高於美元兌日圓,因此帶動主要貨幣兌美元進一步上升。G7會議聲明雖無新意,但是其中仍然顯示國際社會對匯率變化的關注。G7會議聲明中並沒有對日圓下跌發表聲明,但是聲明重申匯率應反映經濟基本面。因此G7預期日本經濟正在復甦且料將延續。這亦顯示G7亦預期日圓最終亦會反映日本經濟復甦,同時匯率過度波動仍會令G7關注。G7後市場重點轉回美經濟。目前美元的下跌一方面是反映美元的結構性問題,而另一方面是對目前美國經濟增長放緩的憂慮,而其中次級按揭問題更加重市場對美國經濟的負面預期。雖然次級按揭的影響有云被誇大,但是問題是既然過去一季美國經濟表現尚未完全反映次級按揭問題及房地產市場調整的影響,這樣第二及第三季美國經濟表現應進一步反映這影響。雖然目前難以預期影響是否最終會令美國經濟陷入衰退,但是美國經濟增長進一步放緩是目前市場的傾向。而這傾向亦是目前美元下跌主要因素。因此,若短期美國數據進一步只是維持在相對低水平增長,這樣美元將會進一步受到壓力。


Strategy:


買入: $685、$690
止蝕: $683、$686

沽出: $688
止蝕: $693

星期四, 4月 12, 2007


Review:

昨日黃金維持高位震盪的走勢,在窄幅的區間中進行波動,收盤價較前一交易日略為收低.現貨金價最低見674美元,最高升至680.7美元,收盤報收於676美元。由於美元在美國公佈通脹數據的前夕保持震盪的態勢,未能有明確的方向,所以正如昨日預期,在消息面明朗化前金價也保持高位震盪。

Weekly Chart

現貨金價已經一連上升6個星期,目前仍然在上升通道,形勢大好、目前今個星期既底部還未下試上周的低位655美元、加上RSI, Stochastic及MACD的配合下盡管已連升多個星期仍然偏向上升的看法。

Daily Chart

昨日現貨金價全日的最低點674.1美元高於前一交易日的最低點671.4美元,可以看到金價雖然保持區間的震盪,但整體的發展趨勢依然是呈現向上的趨勢。從技術圖形分析(上升三角形)金價維持震盪整理的走勢也有利於對短期超買的技術指標進行修復,而指標修復之後金價將有望繼續上攻。預期今日上方的阻力位682.3美元,而下方支持位668美元.重要支持位在661美元及655美元。

Market News and Data:

公佈的美聯儲3月份利率會議紀要顯示,美聯儲官員同意可能需要進一步升息以抑制通脹,但鑒於經濟充滿的不確定性,他們選擇了不再將升息作為其唯一的選擇。

美國政府3月份預算赤字達到962.7億美元,較去年同期上升12.9%,並創下歷年3月份的最高預算赤字紀錄。


Strategy:

揸貨: 676 - 678
止蝕: 673.5

沽貨: 680 - 682
止蝕: 685

星期三, 4月 04, 2007


Review:

Yesterday the gold opened at 664.3, day high 667.5, day low at 661.8 and closed at 663.5. The tension in Iran have tightening the market, investors are holding and wait for the result from British and Iranian. Market is now focus on the resolution of Iran and US market data. Oil dropped 1.91% as Iran foreign office stated they will not get the hostage for trial. It seems soften the tension in Iran. Market expect Iran would not dispute the oil supply. Iran is the second biggest oil supplier.

Technical:

Weekly Chart

On the weekly chart indicate the gold is on a up trend. While all analysis indicators indicates the up is still running in bullish trend. The gold has reached 656 on Monday and hasn't break through last week top at 669. It maybe a signal for gold is switching from bullish to netural. It may also go further to bearish.

Daily Chart

Daily chart indicate more clearly that the gold is now resist on 668. At the moment, it hasn't have much clear direction. However, the gold has already test the resistance for couple of times. RSI is slightly on top of 50. MACD and stochastic also inidicate the gold is on bullish. SMA 20 is below SMA 50 while SMA 10 is above SMA20. The would be a hint for gold is now on a turning point.

Market Data and News:

MBA mrotgage Applications (30 March), consensus with 12.5%, prior -0.2%.
Challenger Job Cuts (YoY) (March), prior -3.9%
ADP Employement Change (Mar), consensus 128K, prior 57K
Factory Orders (FEB), consensus 2.2%, piror -5.6%.
ISM non-Manufacturing (Mar), consensus 55, prior 54.3
EIA crude oil inventory (March 30), prior -0.9M

Strategy:

Long Position: 664, 656
Stop Loss: 661, 653

Short Position: 667, 660
Stop Loss: 669.5, 663

星期一, 4月 02, 2007


Review:

Last week opened at 657.25, week high at 669.5, week low at 654.8 and closed at 663.2, it had 0.91% increased and the range with 14.7. The gold has been raised continously for 4 weeks. By compare to the year opened at 636.3, it already raised for 4.21%. In the first quarter the gold has been moving up and down greatly. The gold followed crude oil dropped to 662 from year opened at 636.3 then raised to 7 months high 689 caused by the tension in Iran and running in recession of USD. The slump from China's stock causes investors withdraw money from other markets to compensate on the lost in stock market. Gold was fallen from Year high 689 to 632, and currently gold has raised to 663.6/4.6 at spot.

Techincal:

Weekly Chart

On the weekly chart wee can see gold have been raised 4 weeks consecutively. From the previous patent gold has been raised for 7 consecutive weeks. The gold is now ahead to the resistance 677, support on 656. However, the the gold shouldn't fall below 660 if this bullsih trend still persist as last week closed at 663.2 and SMA 10 is on 659.25. It is very clear that the SMA 10 is above SMA 20 and other indicators signals the gold is on bullish trend.

Daily Chart

The daily chart indicate the resistance is on 668 and support is on 656. The other indicators such as RSI, MACD are divergence to stochastic. The divergence means the gold have reach the bottom and should technically go up. SMA 10 is slight below SMA20 signals it is not the right time to buy gold in the market. It should wait until the gold on the supporting before buy gold.

Market News and Data:

Last Friday U.S have confirmed to abondan China companies import rebate. The USD have dropped and boost gold rebound from 662 and reached the day high at 667.9. Japanese has released their CPI and the first drop from 10 months, and the first quarter of Tankan Large Manufacturing Index (1Q) have resulted 23 from last quarter of 25.

Long holiday is starting from this Thursday and investors should be cautions fund managers would sell or reduce stocks/units on hand.

ISM manufacturing (MAR) will be release on 22:00. Consensus with 51, prior 52.3. Expecting the result would be similar to consensus.

Strategy:

Long Position: 663, 656
Stop Loss: 660, 653

Short Position: 665, 659
Stop Loss: 668, 662