星期四, 3月 29, 2007


Review:

Yesterday the gold opened at 664.4. day high 669.5, day low 663.3 and closed at 665.1. It was a thin market yesterday. Although, durable good of Feb. did unexpected low 2.5% compare with consensus 3.5% which ignite gold to the day high. The inventory level of crude oil increased 5.1 million barrel, and Bernanke speech of the house lending problem will possibly spill to other sectors. It caused gold and oil pulled back from day high to day low at 663.3.

Technical:

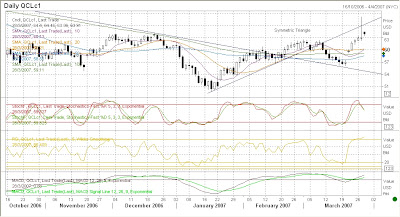
Daily Chart

On the daily chart, the gold price is still in line with the support trend line. Major resistance is on 677.57.

Hour Chart

Hourly chart show more clearly that the gold in line with the support trend line. RSI and MACD indicating the gold is falling. Support is on 662.
SMA 10 is below SMA 20 but slightly higher that SMA 50. If the gold rebound from SMA 50, the gold would have a great power to break through yesterday day high on 669.5. Other wise, it may fall below 662, and test 656.

Market News and Data:

Tension on Iran

U.S. officials denied market rumors of a clash with Iran, while U.K denied anotehr rumor that it had sent troops to secure 15 British sailors and Marines being held by Iran on 23rd March, 2007. "Though markets cools off after the issue subsides, it gives market clues of a potential bull run crude oil and gold can witness when a global unrest of this order emerge" Quoted from Pradeep Unni, an analyst at Vision Commodities Services in Dubai.

Bernake Speaks

Bernanke speaks on U.S economic increased the uncertainty on housing market. U.S Index were drop to 82.75 from 83.05 while Bernanke speaks.

Oil

Yesterday IEA released weekly oi inventories report. Crude oil inceased 5.1M barrel and gasoline was drop lower than expectation caused oil fall back from 64.

Strategy:

Long Position: 665, 663
Stop Loss: 661, 658

Short Position: 669, 666
Stop Loss: 672, 668

星期三, 3月 28, 2007


Review:

The gold opened at 636.6, day high at 665.6 day low 661.3 and closed 636.6 which same as opened. However the crude oil price rise 2.6% due to the tension on Iran. Oil had rised up to 68.09 when rumors U.S force attack Iran.

Technical:

Weekly Chart

On the weekly chart, we can see it very clearly that the top was made on May last year at near 730, and the next top was made at the end of Feb. It was techincally fall in a ascending triangle. In general, the gold would have a big jump when ascending triangle appears. SMA 10 is now 657.25 where SMA 20 is 642.15. These would be a great support for gold at the moment. Where RSI, Stochastic and MACD matched with upward trend gives strong confidence the gold is moving upward.

Daily Chart

Resistance and supporting line is stated on the chart. The supporting trend line for the current period is 660. If price fall below the support trend line would indicate the up trend broken. SMA 10 is above SMA 20 and SMA 50 with other indicators such as RSI and stochastic, MACD tend to upward and would believe the up trend would still persist. Notice that the RSI is near 60 would means this is not the best time to buy gold unless already have profit on hand. Major Resistance would be on 676.

Market Data and News:

The tension in Iran would gives great support on oil and gold. Crude oil rose for a seveneth day in New York on conern a dispute on Iran's detention of British force could escalate, disrupting supplies from the Middle East. Investors concern on military conflict in the Middle East. Iranian foreces seized 15 British forces on 23rd of March and by history U.K has been pretty tough in dealing with these situation. Oil prices have gained 10% in the past 2 weeks as United Nations agreed new sanctions to stop Iran's nuclear research and gasoline break-downs sapped stockpiles.

Euro and others currencies are now moving up caused by the inflation from high oil price and strong economy growth and the contrast from U.S running in recession. Weaken USD would give support for gold. In general, gold runs in opposite direction with USD.

Durable goods order (Feb) would be released on 20:30 HK time. The market would probably have no effect with this result on gold market. Investors now attention on oil price and tension on Iran.

Strategy:

Long Position: 663, 665
Stop Loss: 658, 661

Short Position: 668, 676
Stopt Loss: 673, 679

星期一, 3月 26, 2007


Review:


Yesterday the gold opened at 663.4, day high at 664.2 day low at 655 and closed at 656.6, the drop was caused by the unexpected market data of US exisitng home sales and weaken of EUR.


Technical:


Daily Chart


The up trend has slight broken however, it is still stay on the slope. After the 7th straight day increased gold seems have some profit taking. The resistance would be 666 and support is on 655.


Market Analysis:


Crude Oil


Crude oil rose to the highest in three months on concern Iran's capture of 15 British naval personnel will heighten tensions in the Middle East, source of a third of the world's oil. The captured marines are members of a combined U.S - U.K taskforce partolling Iraq's territorial waters in the Gulf and protecting its oil terminals. Iran has 60 days to ends its uranium enrichment or its arm exports will be blocked, and the overseas assets of 28 more officials and institutions will be frozen (reference by blommberg.) Oil usually move in line with gold.


Gold


Gold declines last friday in the US trade market as increased in U.S home sales boost dollar. Gold fell for the first time in seven straight days after existing home sales data released unexpected jump. It boosted dollar and eroding the appeal of the precious metal as an alternative investment. Gold generally moves in the opposite direction of USD. The dollar climbed against the euro and pared losses against the YEN after the existing home sales data released. Gold may rebound on speculation that the strength of dollar won't last and the housing data won't effect the Fed's stance to abandon its bias toward raising interest rate. Gold is now refocusing on its own fundermentals. Investors should treat profit taking as a buying opportunity.


Strategy:


Long Position: 658, 660 Stop Loss: 656, 657
Short Position: 663, 666Stop Loss: 665, 668

星期二, 3月 20, 2007


Review:

The gold price was opened at 652.7, day high at 656.25, day low at 651.6 and closed at 653.2. It was a thin market and moving within a range 650 and 658. With no important market data yesterday and waiting for Bank of Japan announced judgement of the rate, investors made action to the market.

Technical:

Daily Chart

On the daily chart we can see SMA 10 is approaching SMA 20. Stochastic is divergence to MACD, RSI is near the middle at 51. It seems the bullish trend is building up. Once the price is stand higher than 660 the bullish trend is made.

Hourly Chart

The price is resist on 656 and Indicators are divergence. RSI is on a high range at 68.5. There is a great chance that price would drop few dollars and pull back up. Meanwhile still 650 is a support.

Market data and News:

BOJ have made the decision that keep the rate unchange at 0.5%.
FOMC meeting is on today and tomorrow. Current rate is 5.25%.

The market is seeking a direction from the statement after FOMC meeting. My personal opinion predict the rate will keep unchange as the last PPI and CPI shows the inflation still not dead, although the house lending market has start collaspe.

Data release tonight:

ICSC - UBS
Housing starts (FEB)
Building Permits (FEB)
Redbook (Mar17)
ABC Consumer Confidence (Mar 18)

Housing starts, building permits are the indicators for investors seeing how the buliding constructors foresee the building market. This is more important with house lending market starting to collapse.

Strategy:

Long Position: 652, 648
Stop Loss: 648, 644

Short Position: 656, 660
Stop Loss: 659, 663

星期一, 3月 19, 2007


Review: (weekly)

The gold price was opened at 648.75, week high at 655.1 week low at 636.5 and week closed at 652.4. The gold price climbed almost 2 weeks high because of house lending concern weaken US dollar.

Technical:

Daily Charts

In the daily chart we can see the gold price is moving within a range of 642 - 656. With other analytical indicators shows the gold would have a rising trend is buliding up in the near future. SMA 10 is moving up and try to a cross SMA 20. Once the cross is made. The gold price would have a great energy to move upward.

Hourly Charts

On the hourly chart, it is showing the up trend is made and seems the top would reach 658. Analytical indicators are on a high range. The lower boundry is on 650, and upper bound is on 658

Market News and Data:

No important news release in US today. Note that Bank of Japan will have meeting about rates tonight and tomorrow. US FED would have FOMC meeting regards on meeting on 20-21 Mar.

Strategy:

Long Position: 650
Stop Loss: 647

Short Position: 656, 658
Stop Loss: 659, 661

星期六, 3月 10, 2007


Review:

(05/Mar/2007 - 09/Mar/2007)
The week opened at 643.3, week high 658, week low at 632.3 and closed at 649.9. The gold is slightly stand below 650. Gold price was slump from 4 months high 689 to 632.3 because of investors short position from carry trade since Yen rised. World stock markets were fall from the highest point and investor withdraw money out from gold market to compensate on the loss in stock market. Investors and jewellers started buying from low near 632 and support the gold reached 2 weeks high at 658. As US data released on friday strengthen USD, gold fallen and closed at 649.9

Technical:

Daily Chart

On the daily chart SMA 10 is crossed lower than SMA 20 and on top of SMA 50 which have a great chance the price would bounce back on top of SMA 20. From stochastic, RSI and MACD are on low level. MACD and stochastic are reversal in this stage, and note that stochastic is a prediction indicator and always run faster than MACD. There is a support on 648, and major support on 642. Resistance is on 653 and major resistance is on 658.

Hourly Chart

From the hourly chart it was acurately stated that the resistance is on 658, and the fell to 649. SMA 10 is on top of SMA 20. RSI, stochastic and MACD are on a low range. Those indicators gives signal that is a good timing to buy gold.

Market News and Data:

Short position of carry trade has relief since YEN fall back above 118. However, it is still need to be caution from speech of Japan goverment and bank. USD have strengthen from the market data released on last friday. USD technically has rised above resistance and then pull back under the slope and would predict USD slowly goes down.

Crude oil fall near 60 as it cannot climb above the resistance on 62.5. With the supply crisis in Iran, and ulitilisation of US refineries. The price should be moving from 58 - 62

Strategy:
Long position: 649, 642
Stop loss: 647, 639

Short position: 658, 653
Stop loss: 660, 656

星期四, 3月 08, 2007


Review:

Yesterday gold price opened at 646, day high at 650.6, day low at 642.6 closed at 645.7. However, the gold price rose up to 654 at 8am this rmorning. This is caused by the shortage of oil supply and jewelers tend to buy gold when wide price fluctuations subside, also returning to the market. Uncertain gold supply also the premium to support the gold price.

Technical:

Daily Chart

On the daily chart the support is on 642.02. 10 SMA is above 50 SMA, 100 SMA, and 200 SMA it is showing the bullsih side still persist.
RSI is on 45.41and this is slightly lower than 50, Stochastic and MACD is showing opposite direction and note that stochastic is a prediction indicator and MACD would response slower.

Hourly Chart

On the hourly chart the support is on 642.02 and the resistance is on 656.04, RSI is 68.5 and stochastic and MACD is tend to drop, SMA 10 is above SMA20 and SMA 50. The price would expect have a bounce back up near 650.

Market data and News:
Prior Consensus
Inital Jobless Claims (Mar 3) 338K 333K
Continuing Claims 2640K

The oil price can be project move within a range 57 - 65 as the risk and premium of oil supply, I would expect the oil price is on a strong purchasing bias and would give a great support for gold price. From the USD daily chart is showing the USD is going on down slowly, and the price has bounce back whenever it reach the resistance. The technical chart are greatly reflecting the US economy and it started recesssion.

Carry trade is the issue people most interest today. The risen of JPY causes world stock market slump and investors withdraw money out from the gold market previously when the gold reach 689. The spot price is on 652.3/2.8. The price bounce back from 632 and jewellers purchasing gold and we can see some investor tend to sell JPY and buy gold because gold has strong correlation between equities. The gold have been strengthening after big fall last week.

The nuclear matter in North Korea and Iran would persist and gives a premium for speculation investment on gold price. In the aspect of speculative side, investors would be very caution on the movement of carry trade and money withdraw from stock market and currency market would desposit into gold because gold has the most strong resist when the world market drop. In general, gold is the product hegde against econmic recession.

Strategy:

Long Position: 650, 642
Stop Loss: 648, 639

Short Position: 653, 658
Stop Loss: 656, 661

星期六, 3月 03, 2007


Review:

(26-Feb-2007 - 02-Mar-2007)
The week opened at 681.3 and closed at 642.2, week high at 689.1 and week low at 640.9. It was a dramatical movement week. The week high and week low different with 48.2 and 5.73% down compared with week opened. In general gold price move along same direction with oil. Oil price was rised up to 61.30 last week. However, the gold was down and opposite direction to oil and oil price increased this week, and this is caused by the short position of carry trades of JPY as JPY rised from 122.3 to 116.8. Short position of carry trades will expect will go on until the completion of Japan annual settlement.

Technical:

Daily Chart

On the daily chart, we can see the current resistance is near 689. The upper trend still persist and cannot conclude the sentiment has turned. The price is testing SMA 50 (645.57) , and SMA100 (632.58) is next major support, resistance is near 656. From the stochastic graph, RSI, MACD are clearly stated the price is down.

Hourly Chart

On the hourly chart, stochastic, RSI and MACD are on a low bar. Especailly RSI is on 19.701. However, MACD is still haven't turn from low range. SMA 100 has crossed SMA 200 and noted that SMA 10 and SMA 50 are all below SMA 200. In the hourly chart we can see the market is quite bearish.

Market Data:

The short position of JPY carry trade would bring down the gold market and other commodities market. I would expect the activities would go on until the completion of Japan annual settlement.

Strategy:

Long Position: 640, 632
Stop Loss : 637,628

Short Positon: 646, 654
Stop Loss: 650, 658